Giving Zonneveld Energy Cooperative's 45,000 Members Real-Time Visibility into Their Solar & Wind Output Giving Zonneveld Energy Cooperative's 45,000 Members Real-Time Visibility into Their Solar & Wind Output
1 0 1 1 0 0 1 0
0 1 0 0 1 1 0 1
1 1 0 1 0 1 1 0
0 0 1 0 1 0 0 1
Back to Case Studies
Case Study: Renewable Energy

Giving Zonneveld Energy Cooperative's 45,000 Members Real-Time Visibility into Their Solar & Wind Output

How Kawach Technology gave Zonneveld Energy Cooperative's 45,000 members real-time solar and wind monitoring, cutting fault detection time from weeks to hours.

Renewable Energy 8 months Apr 2025
Explore Project
Weeks → Hours
Fault Detection Time
-58%
Support Ticket Volume
-75%
Payout Processing Time
81%
Member App Adoption
Client Overview

Zonneveld Energy Cooperative

Zonneveld Energy Cooperative lets more than 45,000 Dutch households buy a financial share in one of 60 shared solar and wind sites, which is a genuinely appealing model for people who want to support renewable energy without installing panels on their own roof. The problem was that once a member bought in, they had almost no visibility into what their share was actually doing — how much energy it...

Industry
Renewable Energy
Business Size
45,000+ member households, 60 solar/wind sites
Location
Amsterdam, Netherlands · Software development in Europe
Business Model
Renewable Energy Cooperative
Project Duration
8 months
Existing Challenges
  • Members had no way to see how much energy their invested share of a solar or wind site actually generated.
  • Inverter faults and underperforming panels at remote sites often went unnoticed for weeks.
  • The support team manually compiled generation and payout reports for members on request, taking days per batch.
  • There was no consolidated view across 60 sites for the cooperative's own operations team.
  • Financial payouts to members were calculated in spreadsheets separate from the actual generation data.
The Challenge

What We Were Up Against

Zonneveld Energy Cooperative lets more than 45,000 Dutch households buy a financial share in one of 60 shared solar and wind sites, which is a genuinely appealing model for people who want to support renewable energy without installing panels on their own roof. The problem was that once a member bought in, they had almost no visibility into what their share was actually doing — how much energy it generated, or what their return actually looked like month to month.

That opacity had real operational costs too. Inverter faults and underperforming panels at remote sites often went unnoticed for weeks, since nobody was watching site performance in real time — a fault only surfaced when someone happened to notice a site's output looked off during a periodic review. The member support team, meanwhile, fielded a steady stream of "how much did my share generate this month" requests that had to be answered by manually pulling reports, taking days to turn around a single batch.

Operations had no consolidated cross-site view either — checking on 60 sites meant checking on 60 sites, one at a time. And member payouts were calculated in spreadsheets kept entirely separate from the actual metered generation data, which made the payout process harder to audit than it should have been for a cooperative whose entire value proposition rests on member trust.

Our Solution

How We Built It

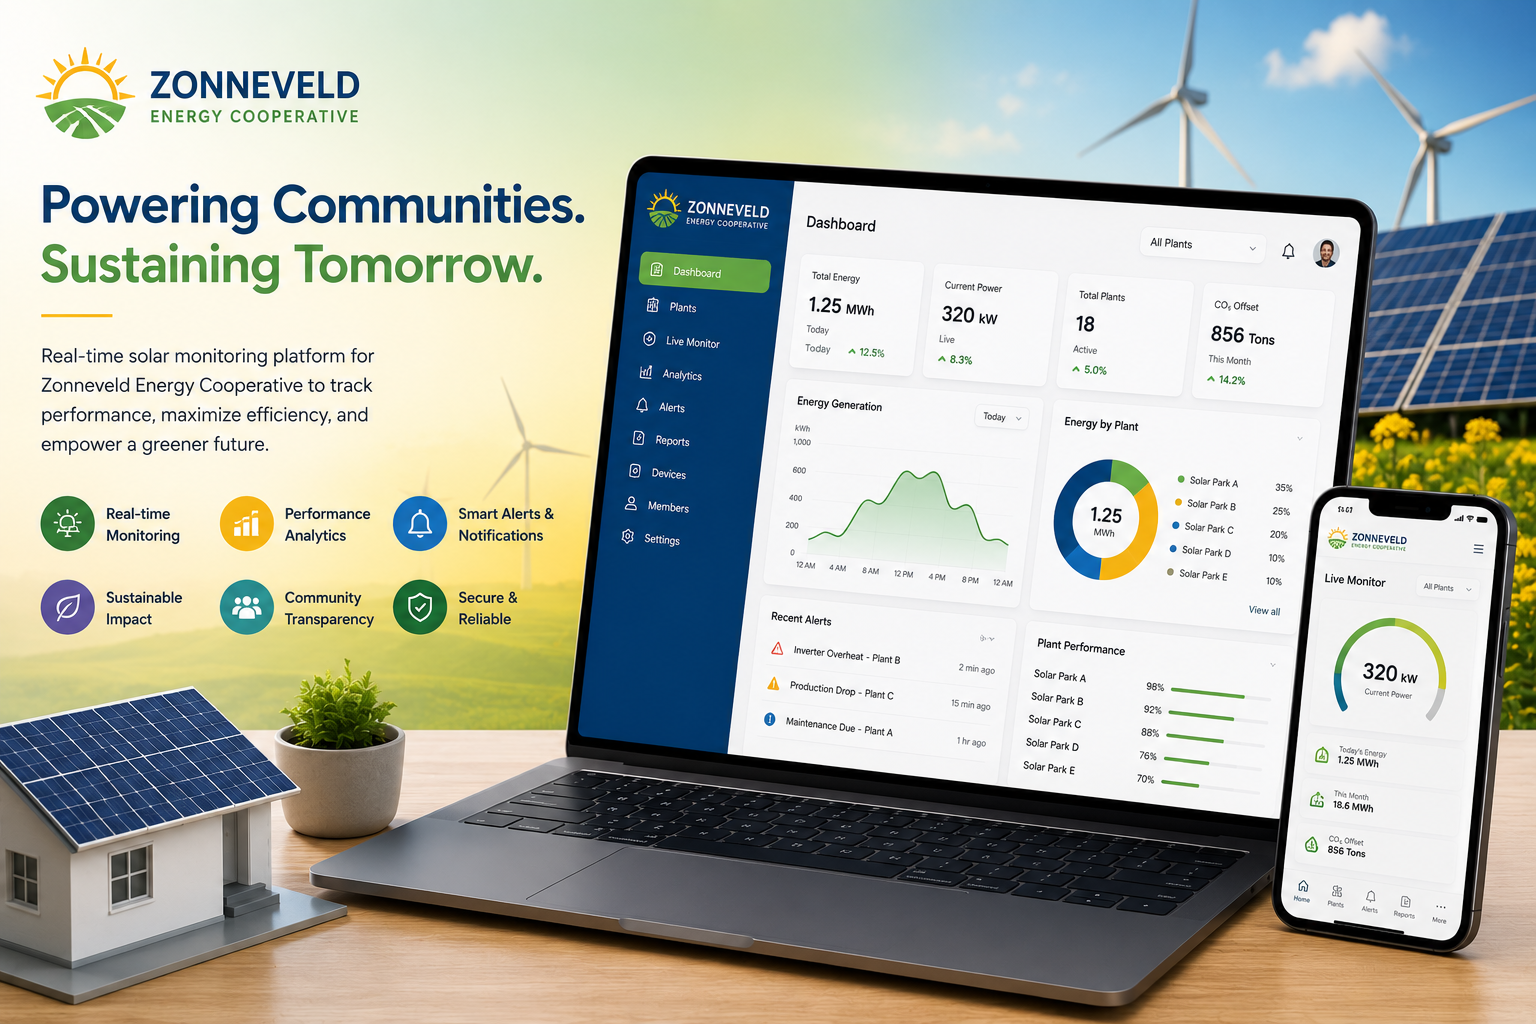
The foundation of everything was getting live telemetry out of all 60 sites into one central time-series platform — inverter output, panel-level performance where available, and turbine data for the wind sites, streamed continuously rather than checked periodically. That data feed made two things possible at once: a real-time member dashboard, and automated fault detection that flags underperformance within hours instead of weeks.

For members, we built a dashboard and companion mobile app showing exactly how their specific invested share is performing — real generation numbers, not an estimate — answering the "how much did I generate" question without a single support ticket. Because member data crosses into GDPR territory and Zonneveld's cooperative model depends heavily on member trust, we made EU data residency and clear data-handling practices a first-class design requirement rather than an afterthought.

The payout calculation engine ties directly to the same metered generation data members see on their own dashboard, which closed the gap between "what members are told they earned" and "what the numbers actually show" — the same number, sourced the same way, visible to both the member and the cooperative's finance team. That single change did more for member trust than any dashboard feature on its own.

We rolled the platform out to members in phases rather than all 45,000 at once, starting with members at a handful of pilot sites so we could validate that automated payout calculations matched what the finance team's manual process had been producing before fully trusting the new system with real money.

Key Modules Delivered
Member Generation Dashboard
Real-time visibility into exactly how much a member's invested share has generated.
Live Site Telemetry Integration
Continuous data streaming from inverters and turbines across all 60 sites.
Automated Fault Detection & Alerts
Flags underperforming panels or inverter faults within hours.
Payout Calculation Engine
Automated, auditable member payouts tied directly to metered generation data.
Operations Command Center
A single consolidated view of all 60 sites for the operations team.
Member Mobile App
On-the-go access to generation data and payout history.
Goals & Objectives

What Success Looked Like

Give Members Real-Time Visibility

Show each member exactly how their invested share is performing.

Detect Site Faults Early

Catch underperforming panels and inverter faults within hours, not weeks.

Automate Member Payouts

Tie payouts directly to metered generation data for full auditability.

Unify Operations Across 60 Sites

Give the operations team one consolidated view instead of 60 separate checks.

Features Developed

What We Built

Real-Time Generation Dashboard

Members see exactly how their invested share is performing.

Automated Fault Alerts

Underperformance and faults flagged within hours.

Member Mobile App

On-the-go access to generation and payout data.

Automated Payout Engine

Payouts tied directly to real, auditable generation data.

Operations Command Center

One consolidated view across all 60 sites.

EU Data Residency

Member data stored and processed within the EU.

Technology Stack

Built With the Right Tools

We selected every technology based on this project's real requirements: compliance obligations, scalability needs, and long-term maintainability. No trend-chasing, only battle-tested solutions.

Backend
Django TimescaleDB (time-series telemetry)
Data Ingestion
MQTT from inverters and turbine controllers
Frontend
Vue.js mobile-responsive PWA
Infrastructure
AWS EU-based data residency
Development Process

How We Delivered It

Agile delivery with regular demos and continuous deployment. Full transparency at every stage.

Total Timeline
8 months
Started → Ongoing
1
01
Site Telemetry Audit

Assessed existing monitoring hardware and data availability across all 60 solar and wind sites.

2
02
Data Pipeline & Time-Series Architecture

Built continuous telemetry ingestion into a central time-series database.

3
03
Fault Detection Model Build

Developed automated underperformance and fault detection logic per site type.

4
04
Member Dashboard & App Design

Designed the member-facing dashboard and mobile app around real generation data.

5
05
Payout Engine Validation

Validated automated payout calculations against the finance team's historical manual process before go-live.

6
06
Phased Member Rollout

Rolled out to members at pilot sites first, then expanded to all 45,000+ members.

Security & Compliance

Built for the Strictest Standards

GDPR-Compliant Member Data
Member account and usage data handling complies fully with EU GDPR requirements.
EU Data Residency
All member and site data is stored within EU-based infrastructure.
Financial Payout Audit Trail
Every payout is traceable back to the specific metered generation data behind it.
Results / KPIs

Measurable Impact

Numbers measured at 6 months post-launch, independently verified by the client's operations team.

Weeks → Hours
Fault Detection Time
-58%
Support Ticket Volume
-75%
Payout Processing Time
81%
Member App Adoption

Before vs. After

Before After
No member visibility into generation or returnsReal-time dashboard per member
Faults undetected for weeksAutomated alerts within hours
Manual spreadsheet payoutsAutomated, metered-data-driven payouts
No cross-site operations viewUnified command center for all 60 sites
"
Our members invest in renewable energy because they believe in it, but belief only goes so far without transparency. Now a member can open the app and see, in real numbers, exactly what their share of a wind turbine generated this week. Support tickets dropped, trust went up, and honestly, our own operations team finally has the visibility across 60 sites that we should have had years ago.
SA
Sanne Dekker
Director of Member Services, Zonneveld Energy Cooperative
★★★★★
Key Achievements

Why This Project Matters

Beyond the numbers: what this project changed day-to-day for Zonneveld Energy Cooperative and the people who rely on what we built.

Fault Detection Cut from Weeks to Hours
Automated monitoring across all 60 sites catches underperformance far earlier than manual review ever did.
Support Tickets Cut by More Than Half
Self-service generation data eliminated the majority of "how much did I generate" support requests.
Automated Payouts for 45,000+ Members
Payouts are now calculated automatically and audibly tied to real metered generation data.
FAQ

Common Questions

Have more questions? Book a call with our team.

How is member data kept GDPR-compliant?
All member data is stored on EU-based infrastructure with clear consent capture and data-handling practices built in as a core design requirement, not an afterthought.
How are member payouts calculated and verified?
Payouts are calculated directly from the same metered generation data members see on their own dashboard, and we validated the automated calculations against the finance team's historical manual figures before trusting the system with real payouts.
How accurate is the fault detection system?
It was tuned per site type — solar panel arrays and wind turbines fail in different ways — and validated against real historical fault events across pilot sites before wider rollout.
How did you onboard 45,000 existing members to a new system?
We rolled out in phases starting with members at a handful of pilot sites, which let us fix onboarding friction points before scaling to the full membership base.
Related Case Studies

More Success Stories

Ready to Get Started?

Looking for Custom Renewable Energy Software Development?

Kawach Technology helps startups and enterprises build scalable, secure, and high-performance digital platforms. Let's turn your vision into the next success story.

View All Case Studies

Want a similar result for your business? Explore our ERP Development services , or see how we work with businesses in Europe , or get in touch directly.